Curating a Comprehensive Nutrition Dataset: Combining USDA API Data with Recipe Scraping
How I built an original nutrition dataset by combining USDA FoodData Central API data with AllRecipes recipe categories, exploring macronutrient profiles across food groups
Introduction: Why Nutrition Data Matters
Understanding the nutritional composition of foods is crucial for making informed dietary choices, whether you're tracking macros, planning meals, or analyzing dietary patterns. While nutrition databases exist, creating a curated dataset that combines multiple sources provides unique insights into how macronutrients vary across food categories and meal types.
This project demonstrates how to ethically combine API data with web scraping to build an original dataset. By integrating the USDA FoodData Central API with recipe category information from AllRecipes, I created a comprehensive nutrition dataset with 244 observations and 24 features that reveals fascinating patterns in macronutrient distribution.
The Research Question
How do macronutrient profiles vary across different food categories and meal types?
This question drives the entire project. By exploring protein, fat, and carbohydrate distributions across food groups, we can uncover patterns that inform meal planning, dietary analysis, and nutritional understanding. The dataset enables us to answer questions like:
- Which food groups are highest in protein percentage?
- How do macronutrient ratios differ between meal types?
- What are the most protein-dense foods in the dataset?
- How do cooking methods affect nutritional profiles?
Ethical Data Collection: Doing It Right
Before diving into data acquisition, it's essential to ensure ethical and legal data collection practices.
USDA FoodData Central API
The USDA FoodData Central API is a public resource designed for developers to access comprehensive nutrition data. Key ethical considerations:
- Public API: The USDA provides this data as a public service, but requires an API key for access
- Rate Limiting: The API has rate limits (typically 1,000 requests per hour per IP) that must be respected
- Attribution: While not always required, proper attribution to USDA is good practice
- Terms of Service: The API is intended for legitimate use cases like research, applications, and educational purposes
AllRecipes Web Scraping
For web scraping, I followed responsible practices:
- Robots.txt Compliance: Checked AllRecipes'
robots.txtfile to understand scraping permissions - Rate Limiting: Implemented delays between requests to avoid overwhelming servers
- User-Agent Headers: Used proper user-agent strings to identify the scraper
- Respectful Scraping: Only scraped publicly available recipe category information, not personal data
- Terms of Service Review: Ensured compliance with AllRecipes' terms of service
Key Principle: Always respect website resources and terms of service. If in doubt, reach out to website administrators or use official APIs when available.
Building the Dataset: A Two-Source Approach
Creating an original dataset requires combining multiple data sources thoughtfully. Here's how I approached it:
Step 1: USDA FoodData Central API Integration
The USDA API provides comprehensive nutrition data for thousands of foods. Here's the general approach:
Getting Started:
- Obtain an API Key: Register at fdc.nal.usda.gov to receive your API key
- Explore Endpoints: The API offers several endpoints including food search, food details, and nutrient information
- Understand Data Structure: Each food item includes detailed nutrient information with standardized units
Data Extraction Process:
- Used the search endpoint to find foods matching specific categories
- Extracted key nutrients: calories, protein, fat, carbohydrates, fiber, and micronutrients
- Stored data with food identifiers (FDC IDs) for traceability
- Handled API rate limits by implementing request delays
What We Got:
- Comprehensive nutrition data for 244 food items
- Standardized nutrient values (grams, milligrams, etc.)
- Food descriptions and metadata
- Data type information (SR Legacy, Foundation Foods, etc.)
Step 2: AllRecipes Recipe Category Scraping
To enrich the dataset with recipe context, I scraped category information from AllRecipes:
Scraping Approach:
- Identify Target Pages: Located recipe pages for foods in our dataset
- Parse HTML: Used BeautifulSoup to extract recipe metadata
- Extract Categories: Collected information about meal types, cuisine types, cooking methods, and recipe categories
- Data Cleaning: Standardized category names and handled missing values
Technical Implementation:
- Used
requestslibrary for HTTP requests - Implemented
BeautifulSoupfor HTML parsing - Added proper headers and rate limiting
- Handled edge cases (missing categories, different page structures)
What We Got:
- Meal type classifications (Breakfast, Lunch, Dinner, etc.)
- Recipe types (Dessert, Main Course, Side Dish, etc.)
- Cuisine information (Italian, American, etc.)
- Cooking method data (Grilled, Baked, etc.)
Step 3: Data Integration and Cleaning
Merging data from two sources requires careful data engineering:
Integration Challenges:
- Matching Foods: Linking USDA foods with AllRecipes recipes required fuzzy matching on food names
- Missing Data: Some foods didn't have corresponding recipe information
- Standardization: Normalized category names and units across sources
- Feature Engineering: Created derived features like macronutrient percentages and ratios
Final Dataset Structure:
- 244 observations across 7 food groups
- 24 features including original nutrients, percentages, ratios, and categories
- 7 food groups: Protein, Dairy, Grain, Fruit, Vegetable, Nuts/Seeds, Fats/Oils
Exploring the Data: Key Findings
The exploratory data analysis revealed fascinating patterns in macronutrient distribution:
Dataset Overview
- Total Observations: 244 foods
- Features: 24 variables including nutrients, percentages, and categories
- Food Groups: 7 distinct categories
- Numeric Features: Calories, protein (g), fat (g), carbs (g), fiber (g), and various micronutrients
Summary Statistics by Food Group
The analysis shows clear patterns across food groups:
Protein-Rich Groups:
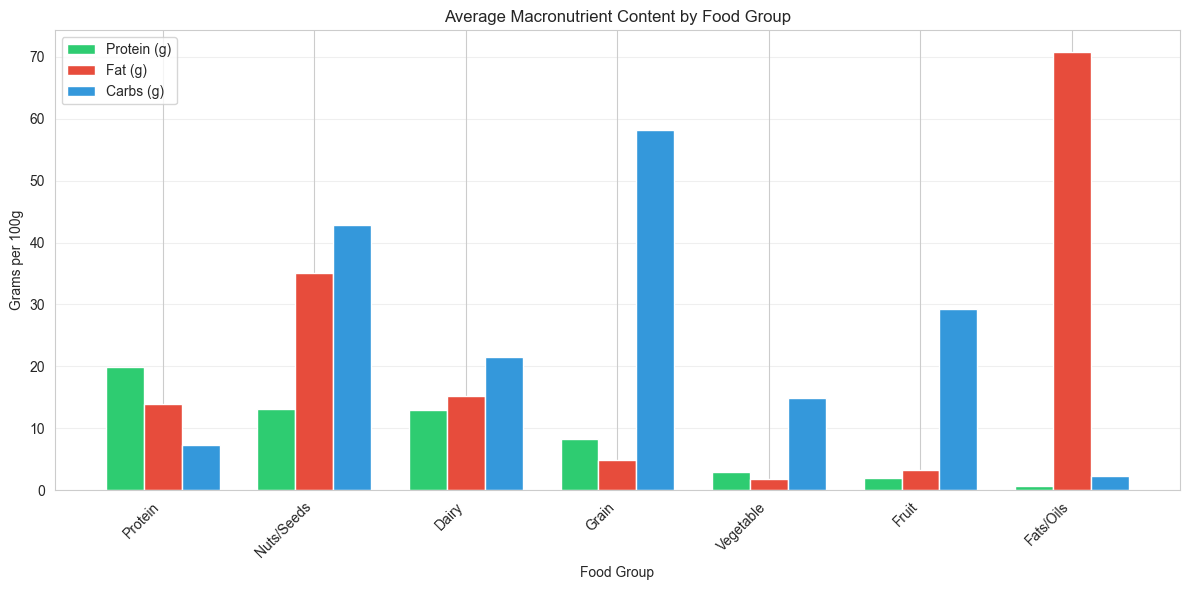
- Protein Group: 19.85g average protein, 10.0% of calories from protein
- Vegetable Group: 2.88g average protein, 5.2% of calories from protein
- Dairy Group: 12.90g average protein, 4.1% of calories from protein
High-Fat Groups:
- Fats/Oils: 70.75g average fat, 22.97% of calories from fat
- Nuts/Seeds: 35.09g average fat, 13.64% of calories from fat
Carbohydrate-Rich Groups:
- Grain: 58.22g average carbs, 17.97% of calories from carbs
- Fruit: 29.34g average carbs, 20.85% of calories from carbs
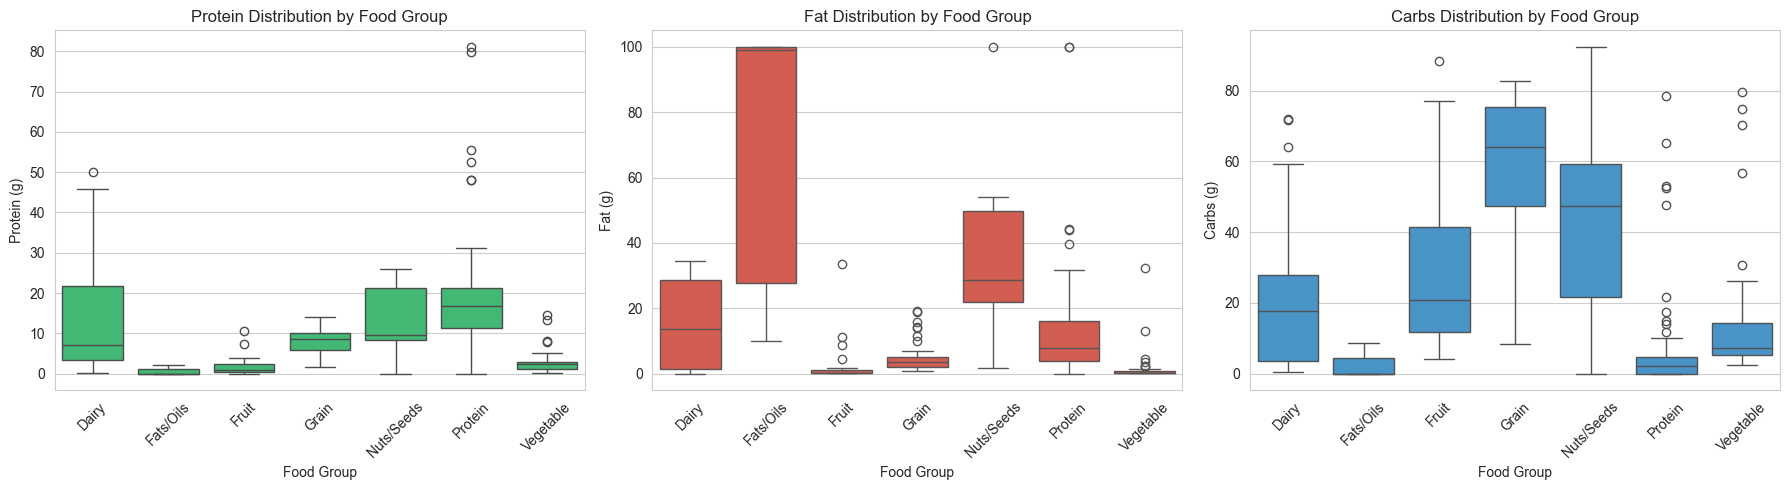
Key Visualizations
The EDA included several visualizations that highlight important patterns:
- Macronutrient Distribution by Food Group: Shows how protein, fat, and carbs vary across categories
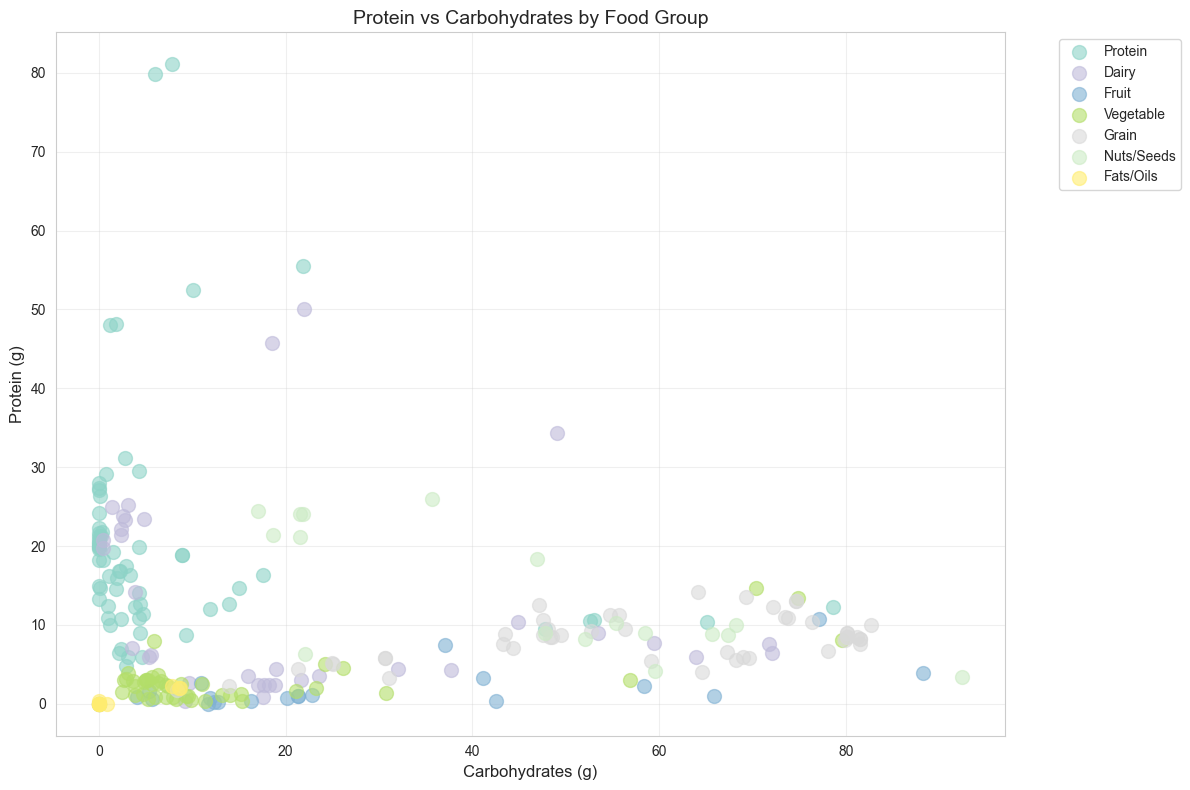
- Protein vs Carbohydrates Scatter Plot: Reveals relationships between macronutrients
- Summary Statistics Dashboard: Provides comprehensive overview of the dataset
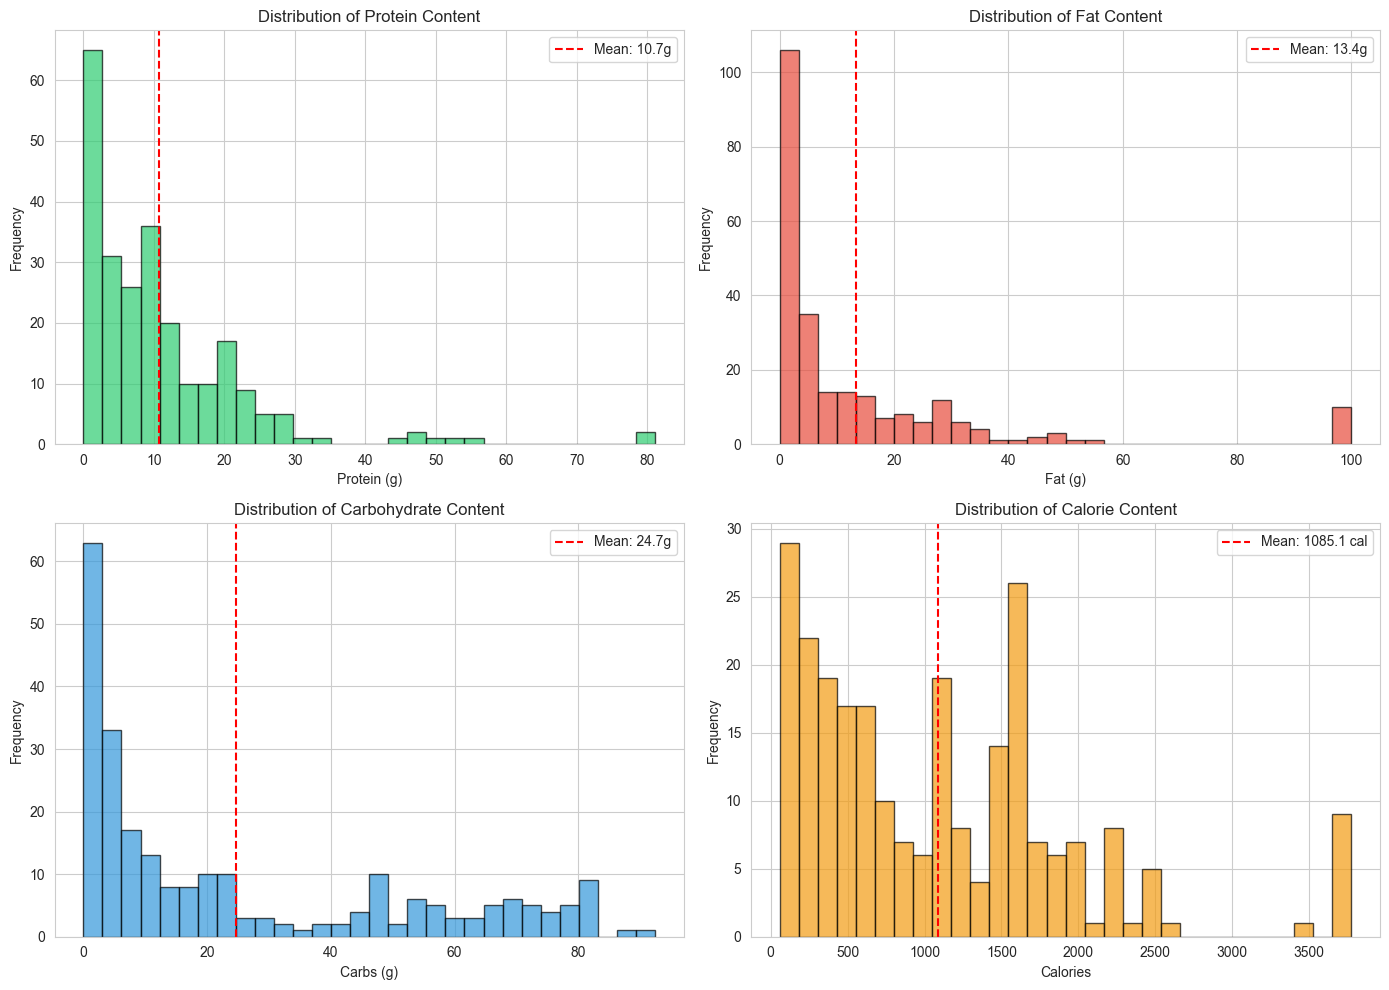
Extreme Values and Outliers
Highest Protein Foods:
- Egg, white, dried: 81.1g protein per 100g
- Various protein group items with 19-20g average protein
Highest Fat Foods:
- Fish oil, salmon: 100.0g fat per 100g
- Fats/Oils group averaging 70.75g fat
Highest Carb Foods:
- Candies, nougat, with almonds: 92.4g carbs per 100g
- Grain group averaging 58.22g carbs
Most Interesting Discoveries
Several findings stood out during the analysis:
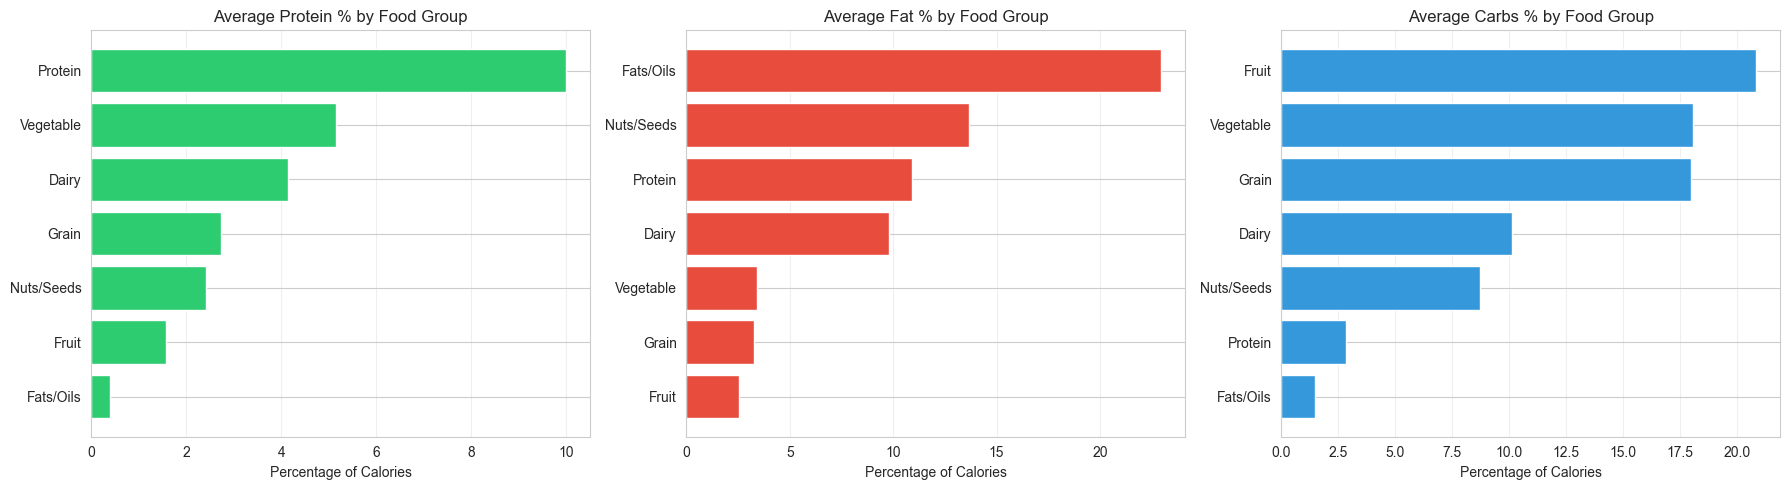
1. Protein Distribution Patterns
Surprising Insight: While the Protein food group leads with 10.0% of calories from protein, vegetables rank second at 5.2%—higher than dairy (4.1%) and grains (2.7%). This challenges common assumptions about protein sources.
Practical Application: For plant-based diets, vegetables contribute more protein percentage than expected, though absolute amounts are lower.
2. Macronutrient Ratios by Food Group
The protein-to-carbohydrate ratios reveal distinct patterns:
- Protein Group: High ratios (e.g., 8.15 for chicken breast), indicating protein-dominant foods
- Grain Group: Low ratios, showing carbohydrate-dominant profiles
- Nuts/Seeds: Moderate ratios, representing balanced macronutrient profiles
3. Average Macronutrient Distribution
Across all foods, the average distribution shows:
- Protein: 5.2% of calories
- Fat: 8.0% of calories
- Carbs: 11.4% of calories
This suggests the dataset includes diverse foods, not just high-protein or high-carb items.
4. Food Group Characteristics
Each food group has distinct nutritional signatures:
- Fats/Oils: Extremely high fat content (70.75g average) with minimal protein and carbs
- Protein: Balanced with high protein (19.85g) and moderate fat (13.92g)
- Grain: Carbohydrate-dominant (58.22g) with lower protein and fat
- Vegetable: Low-calorie, moderate protein percentage (5.2%) despite low absolute amounts
Lessons Learned & Getting Started
Key Takeaways
-
API Integration is Powerful: The USDA API provides reliable, standardized nutrition data that would be difficult to collect manually
-
Web Scraping Requires Care: Ethical scraping involves respecting rate limits, robots.txt, and terms of service
-
Data Integration is Complex: Merging data from multiple sources requires careful matching, cleaning, and validation
-
EDA Reveals Patterns: Exploratory analysis uncovered unexpected relationships, like vegetables' protein percentage ranking
Tips for Similar Projects
For API Integration:
- Read API documentation thoroughly
- Implement proper error handling and rate limiting
- Store API keys securely (never commit to version control)
- Cache responses when possible to reduce API calls
For Web Scraping:
- Always check robots.txt first
- Use delays between requests (1-2 seconds minimum)
- Implement retry logic for failed requests
- Handle edge cases (missing data, different page structures)
For Data Integration:
- Use fuzzy matching for linking records across sources
- Document data transformations clearly
- Validate merged data for consistency
- Create derived features that add value
Resources & Next Steps
Project Resources
- GitHub Repository: food-nutrition-api-scraping
- EDA Notebook: Exploratory Data Analysis
- USDA FoodData Central API: API Guide
- USDA FoodData Central: Main Website
Python Libraries Used
- requests: For API calls and web scraping
- BeautifulSoup: For HTML parsing
- pandas: For data manipulation and analysis
- matplotlib/seaborn: For visualizations
- numpy: For numerical computations
Future Enhancements
Potential extensions of this project:
- Expand dataset to include more foods and categories
- Add temporal analysis (seasonal nutrition patterns)
- Incorporate recipe ingredient analysis
- Build a meal planning application using the data
- Analyze micronutrient patterns (vitamins, minerals)
Conclusion
This project demonstrates how combining API data with web scraping can create original, valuable datasets for analysis. By ethically collecting data from USDA FoodData Central and AllRecipes, I built a comprehensive nutrition dataset that reveals interesting patterns in macronutrient distribution across food categories.
The key achievement: Creating an original dataset (244 observations, 24 features) that combines standardized nutrition data with recipe context, enabling analysis that wouldn't be possible with either source alone.
The methodologies used—API integration, ethical web scraping, and data engineering—provide a foundation for future data acquisition projects. Whether you're interested in nutrition, health data, or any other domain, these techniques are transferable to many data science projects.
For students working on similar projects: Start with official APIs when available, implement ethical scraping practices, and focus on creating datasets that answer interesting questions. The combination of multiple data sources often yields the most valuable insights.
Interested in exploring the code and analysis? Check out the GitHub repository for the complete implementation, including the EDA notebook with all visualizations and findings.